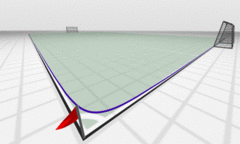
 Why long tail graphs are usually shown on a log scale:
Unfortunately, the illustration works only as a large graph, because graphed out on small paper gives us only two discernable lines, one on each axis.
— A practical model for analyzing long tails, by Kalevi Kilkki First Monday, volume 12, number 5 (May 2007)
The sports field graph is a clever way of showing how the fat head of a long tail distribution can be extremely higher than the long tail; this is normally not so clear on log scale graphs.
Continue reading